
-
Summary
-
Six Sigma Background and History
-
What is Six Sigma Fitness™?
-
Six Sigma Fitness™ vs. Six Sigma Business
-
The Six Sigma Fitness™ Methodology Applied
-
Six Sigma Applied To The Health And Fitness Sciences3 Topics
-
Taxonomy: Frameworks, Methodologies and Tools
-
DMAIC
-
Frameworks
-
Methodology Categories1 Topic
-
Framework Of Methodologies Applied
-
Methodologies
-
Tools
-
Putting Frameworks, Methodologies and Tools All Together
Participants 21


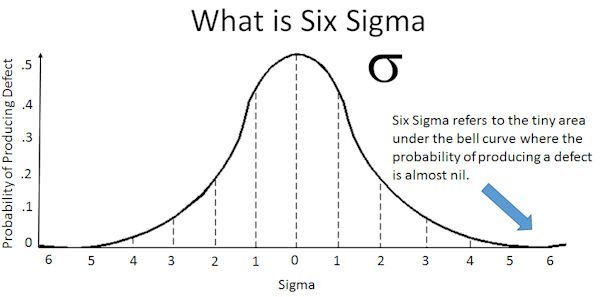
Six Sigma is a symbol of defects per million, or more precisely, 3.4 defects or errors per million (3.4/1,000,000 = .00000034). There are six “0’s” following the decimal point and preceding the 3.4; hence, the “ Six” in Six Sigma. The standard deviation (represented by the Greek letter Sigma, σ) shows how much variation or dispersion from the average or ideal exists. Everyone’s health and fitness metric data lies to the left or to the right of the norms or ideals. Just how far to the left or the right on the bell curve is measured by “standard deviations”.
For example, If a data distribution is approximately normal then about 68 percent of the data values are within one standard deviation of the mean, or average (mathematically, μ ± σ, where μ is the arithmetic mean). Further, about 95 percent of the data values are within two standard deviations (μ ± 2σ), and about 99.7 percent lie within three standard deviations (μ ± 3σ). In our case, the average value of a health statistic for the general population would likely be unhealthy, as populations quickly skew to more and more diseased states. For example, 6 sigma (deviations) in the right direction under the bell curve would be a more optimal state, as most people would be in the middle of the curve with some sort of less-than-optimal state, or one in which their body is producing more defects such as high blood pressure or body fat composition.